


When using a machine learning model to provide insights for your clients, it’s important to have a strong understanding of what the client is trying to accomplish. Their goals, risk tolerances, and resources all play a part in tuning your model to give them the best possible outcomes.
This primer covers the output of machine learning models. Let’s explore what a machine learning classifier provides as output, some of the ways to quantify a classifier’s performance, and why the “best” metric changes according to the problem you’re solving.
A Simple Classifier Example
When a machine learning classifier makes a prediction in yes or no classification problems, it provides a number between 0 and 1. If that number is above a predetermined threshold, that the sample is a member of the target class (e.g. “Does this person have diabetes?”, with “diabetic” being the target class). When it makes such predictions, it can either be correct or incorrect. So, there are four possible outcomes: true positive, true negative, false positive, and false negative. A true positive means we predicted a sample belonged to our target class (“positive”), and it actually did (“true”). Similarly, a false negative means we predicted that a sample did not belong to our target class (“negative”), we were wrong (“false”).
Suppose you had a classifier that was trying to determine if a picture contained a dog.
| Is there actually a dog in the picture? | |||
| Yes | No | ||
| Did we predict there is a dog in the picture? | Yes | TP | FP |
| No | FN | TN | |
The table above indicates the four possible outcomes for our classifier. Now let’s add numbers. Suppose we analyze 100 images, 40 of which contain dogs.
| Is there actually a dog in the picture? | |||
| Yes | No | ||
| Did we predict there is a dog in the picture? | Yes | 35 | 3 |
| No | 5 | 57 | |
Of the 40 pictures that contained dogs, our classifier said that 5 of them did not have a dog. Similarly, of the 60 pictures that did not have a dog, our classifier said that 3 of them did.
Measuring Classifier Performance
These four possible outcomes—true positive, true negative, false positive, and false negative—can be combined into various statistics to quantify the performance of a classifier. Two of the most common are precision and recall.
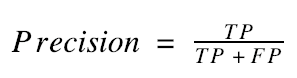
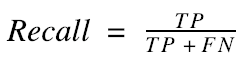
In plain English, precision answers the question, “Of all the pictures that I said had dogs in them, how many actually had dogs in them?” Similarly, recall answers the question, “Of all the pictures that actually had dogs in them, how many did I say had dogs in them?”
In the case of the classifier summarized above, we had a precision of 92% (35 / 38) and a recall of 87.5% (35 / 40). These numbers tell us the following: If we predict that a picture has a dog in it, we’ll be right 92% of the time, and if you give us a bunch of pictures (some with dogs and some without), we’ll find 87.5% of the pictures that have dogs in them.
Improving Classifier Performance
Precision and recall are objective measures of a classifier’s performance. The higher those numbers are, the better the classifier is doing. Unfortunately, precision and recall are often working against each other. In most applications, getting extremely high precision means you’ll have to sacrifice your recall, and vice versa.
For example, looking at the equations above, we can see that the way to get extremely high precision is to make a classifier that has a very high number of true positives and a very low number of false positives. How do you do this? You tune your classifier so it only says a picture has a dog in it if the classifier is extremely sure—let’s say 95% sure—that there’s a dog in the picture. However, this will kill your recall. If you’re only saying there’s a dog if you’re 95% sure, that means you’ll say a picture doesn’t have a dog in it even if you are 94% sure it does. This makes the number of false negatives go way up, which makes recall go down.
In light of this tug-of-war between precision and recall, it’s important to understand what each one means and what the goals and constraints of your project are. Furthermore, it’s important to understand if you should even be using precision and recall in the first place.
Common Classifier Performance Metrics
Below are listed several of the most common metrics for measuring classifier performance. Think of the “target class” as “the picture has a dog in it.”
|
Metric |
Other Names | Formula |
English |
| Precision | Positive Predictive Value | Of all the things I said are in the target class, how many are in the target class? | |
| Recall | Sensitivity, True Positive Rate | Of all the things in the target class, how many did I say are in the target class? | |
| Specificity | True Negative Rate | Of all the things not in the target class, how many did I say are not in the target class? | |
| False Negative Rate | Of all the things in the target class, how many did I say were not in the target class? | ||
| False Positive Rate | Fall-out | Of all the things not in the target class, how many did I say belong to the target class? | |
| Accuracy | Of all the predictions I made, how many were correct? | ||
| F1-Score | The harmonic mean of precision and recall | An average of precision and recall, weighting each equally. |
The first question you may have is, “Why do some of these metrics have two or three names?” That really just depends on the field in which the metric is being used. For example, sensitivity and specificity are traditionally used to refer to binary classification, while precision and recall are often used in pattern recognition and information retrieval. Note that sensitivity and recall are the same thing.
Why are there so many performance metrics? And why don’t we just use accuracy, since it’s simple and easily understood? The answer to the latter question gives us the answer to the former.
Take the case of credit card fraud. Somewhere close to 99.9% (maybe more) of credit card transactions are valid. If we are making a classifier to detect credit card fraud, we aren’t as concerned with correctly identifying valid transactions—we’re interested in detecting fraud. In this case, accuracy does not quantify the goal that we are trying to achieve. We could make a very simple classifier that classifies every transaction as valid. We would have 99.9% accuracy, which sounds very high, but we would incorrectly classify every case of fraud.
What if we used sensitivity and specificity as our metrics for the credit card fraud case? Our very simple classifier would have 100% specificity, meaning that we would correctly identify every valid transaction as valid, but 0% sensitivity, meaning that we would label every case of fraud as valid. These metrics clearly demonstrate that our classifier is doing a very poor job at performing the task we designed it for.
If I were designing such a classifier, I would use precision and recall as my metrics. In the case of our simple classifier, we would have 0% recall and undefined precision (since the denominator of the precision fraction would be 0). The primary reason I would make this choice is that precision-recall curves are generally more visually interpretable than ROC curves. The reason for this is out of the scope of this article, but here’s a link for further reading if you’re interested.
In Conclusion
Understanding classifier performance is crucial for developing effective machine learning models that generate value. The performance metrics you choose should not only make sense given the problem, as we saw in the credit card fraud example, but should also align with your clients’ goals. The next time you build a machine learning classifier, calculate all of the metrics in the table above, and see which ones are most indicative of how well you’re actually doing.